DShield Cowrie Honeypot on Raspberry Pi
This post provides an overview of the DShield honeypot I set up during my internship with SANS ISC. A honeypot is a decoy system designed to attract cyber attackers, allowing defenders to observe attack methods and gather intelligence without risking production systems. The DShield honeypot, developed by SANS ISC, is an open-source system that can be easily installed on a Raspberry Pi.
Attack Observation Disclaimer
This post is based on a research assignment completed during my time with the SANS Internet Storm Center internship program. The data represented was collected using a personal Cowrie/DShield honeypot running on a Raspberry Pi CM4. Please note that this observation reflects findings at the time of analysis and may no longer be relevant, as attack vectors and threat actor behaviors evolve rapidly. Any businesses, sources, or indicators mentioned are included as originally observed and should not be considered current or actionable without further verification. This write-up is based on two separate assignments originally written on August 12th, 2024 & November 25th, 2024.
What is a DShield Honeypot?
SANS Internet Storm Center (ISC) has created an open-source honeypot system that can be easily installed onto a Raspberry Pi. This honeypot poses as a vulnerable web-server to trap threat actors and log events, actions, download, and more. All the logs and files generated within the honeypot can be used to deconstruct how attacks function in the real world. More information on DShield can be found on GitHub.
My Honeypot Setup (August 2024)
I ran my honeypot on a Raspberry Pi CM4 system using a Waveshare Mini Base Board to add peripherals such as USB ports, GPIO headers, and Ethernet. When I first created this system (August 2024), DShield did not have the CM4 board listed as a compatible system; however, that may have changed since. At the time, I only had a single spare Raspberry Pi CM4 board, as all my other Raspberry Pis were being used for other projects.
About the CM4 Board (August 2024)
The CM4 board differs from typical Raspberry Pi devices because it has no peripheral connection ports. To use peripherals, you need to purchase a compatible development board for the CM4.
About two years ago, I used this device as a personal, free-time project for the last company I worked for. The company needed a lower-cost alternative to the Raspberry Pi due to a shortage of boards at the time. I purchased the CM4 board and ran various tests to see if it would meet the company’s needs.
Fortunately, the company was able to secure a bulk amount of Pi boards for a reasonable price, so I had no need to continue working on the CM4 board. It sat in a storage bin in my closet until I decided to see if it would work with DShield—which it did.
ISP & Static IP Use (August 2024)
Identifiable information such as my ISP and internet plan are redacted for privacy reasons
I have five allotted static IP addresses assigned to my home internet plan, which I’ve had for about six years. This setup has allowed me to host websites and run projects like proxy and automation servers. Here’s how the static IPs are assigned:
- Primary network connection: Used for both my main desktop PC and my web server (separated by a VLAN). While this setup could be seen as risky, it allows me to monitor my web server more thoroughly and access files, admin pages, and more without needing an internet connection. This setup has been safe for years.
- IoT network: One static IP is used for a Wi-Fi network dedicated to IoT devices.
- Home Wi-Fi: Another static IP is used for a simple home Wi-Fi network.
- DShield honeypot: The fourth static IP is currently used for my DShield honeypot setup. At the moment, this network has no additional devices other than the honeypot itself, though I plan to add a small computer as a temporary server to collect more information from the honeypot.
Setup Process Details (August 2024)
The honeypot setup was initially confusing, and I encountered a couple of issues before getting it working:
- Ubuntu Server 22.04 installation: My CM4 board model comes with 32GB eMMC storage. Installing an OS onto the eMMC requires a specific switch on the dev-board to override the micro-SD card boot. Unfortunately, the dev-board lacked proper documentation for installing an OS onto the eMMC. After 15–30 minutes of research, I found the correct setup and drivers to have the board recognized by my Windows computer. I then used Raspberry Pi Imager to write the image.
- The Waveshare documentation explains the need to install the “rpiboot software” to write an image onto the board.
-
DShield setup: After installing Ubuntu Server 22.04, I made a minor mistake during the DShield setup. My attempt to reverse the installation corrupted the OS, requiring me to re-image the board.
-
Log collection issue: After reinstalling, I tried to view logs sent to DShield but nothing appeared for over 30 minutes. After discussing the problem on Slack, I learned that putting the honeypot on a DMZ resolved the issue.
Observations After 3 Months (November 2024)
From this section on, I will be discussing my honeypot observations up until November 25th, 2024.
After successfully setting up the honeypot, I began collecting and analyzing data over the next three months. The following is a detailed overview of the methods, scripts, tools, and services I used for my attack observations. I’ll also provide an overview of my network and systems setup, with visualizations to show how information was gathered, stored, parsed, and analyzed.
Elastic Stack (November 2024)
The most important tool I have used throughout all my attack observations would be my Elastic Stack (ELK) server. Elasticsearch, Logstash, and Kibana are all useful tools that allowed me to visualize my data and learn about the importance of logging data.
During the first few weeks of the internship, I set up an ELK stack server on a X86 ZimaBlade SBS (Single Board Server) with 16GB RAM. Surprisingly, the entire ELK stack ran on this board, albeit slowly, and allowed me to finally use Kibana to visualize my data.
This system began to show its constraints when my logs began to accumulate over 2 million entries. However, during the last two to three months, I was in between completely moving my local web server into the cloud. This left me with a Dell Poweredge R610 server that had no purpose anymore. This server has 128GB RAM, two CPUs, and about 4TB of SSD storage set up as RAID 10. With my weeks of exploring and learning about Elastic Stack, I decided to set up my server with this and begin analyzing data from not only my honeypot but other log inputs such as my local ZEEK setup, cloud server logs, etc.
Honeypot Log Collection (November 2024)
When my ZimaBlade ELK server was still in use, I decided not to expose it externally since I was new to Elasticsearch and wanted to avoid misconfigurations that could expose my network. My only method of log collection for analysis was to plug a USB drive into the honeypot and manually copy over log files to parse.
After two weeks, I created a simpler method that didn’t require exposing my ELK server to external connections.
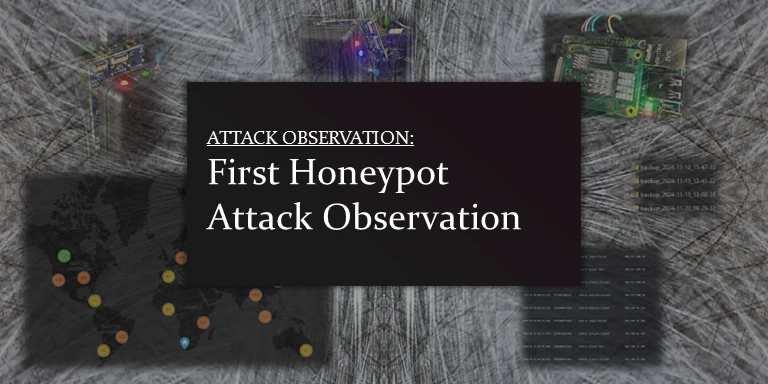
My CM4 board is attached to a small box with three LEDs and a pushbutton switch. How this box worked was simple, when a USB drive was plugged into the Pi, the first red LED (left) would switch on indicating that the system detected a storage drive. Clicking the blue pushbutton switch would tell the system to activate a script which automatically mounts my flashdrive and copies over all log files into an organized and timestamped folder. The system indicates that the transfer is in progress with the blue LED (middle).
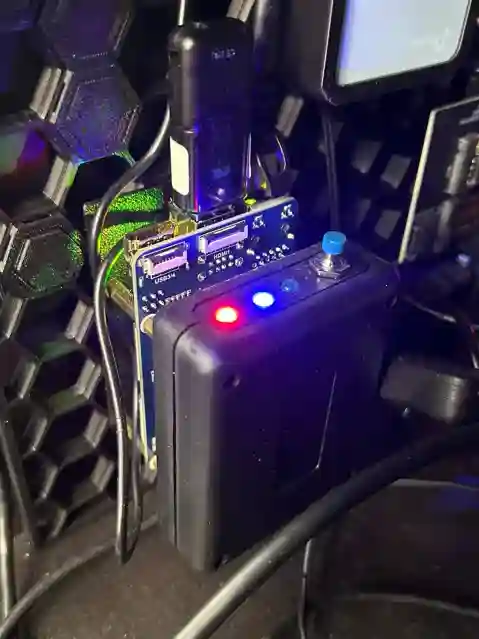
The transfer is only completed when the green light is switched on and the blue light is switched off. The green light indicates success and that the drive was unmounted and safe to remove.
Once unplugged, all lights turn off again. If the script encounters any errors, the red LED will begin to blink every second to indicate that manual intervention is needed. These errors could result from a mounting issue, insufficient storage on the drive, or transfer issues.
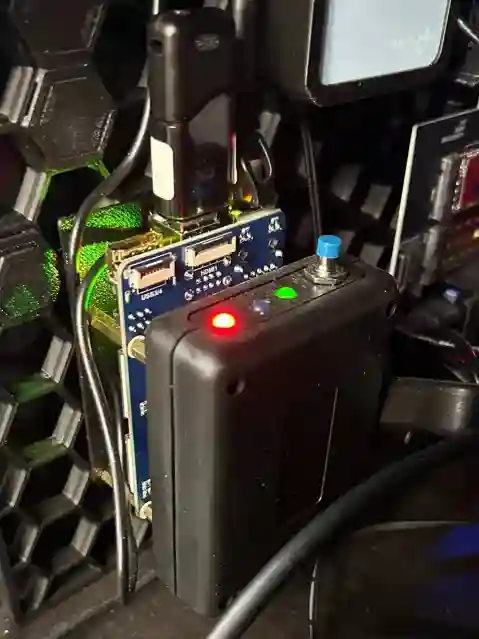
Once the drive is plugged into my main computer, all transfers are visible, and the folder layout looks like this:
Honeypot Log Analysis (November 2024)
Once I captured all my log files, I used several scripts to parse and transfer these logs to my ELK server.
Cowrie.json Logs
I used several Python scripts to clean, parse, and upload these logs to my ELK server:
- Cleaning: I wrote a script to remove empty lines (usually at the end of each Cowrie JSON file) and another to ensure each entry was correctly formatted and complete.
- Combining: Another script combined all Cowrie logs from the “input” folder into a single JSON file, maintaining proper timestamp order and removing duplicates. Duplicates could occur if the current day's incomplete log was included in multiple collections.
- Uploading: A final script uploaded each entry to my ELK server. The Cowrie logs were indexed as “Cowrie_index,” with mappings to ensure all data was available for analysis. The script also checked for UTF-8 encoding and performed final formatting checks, since a single mistake could mean missing important information for attack analysis.
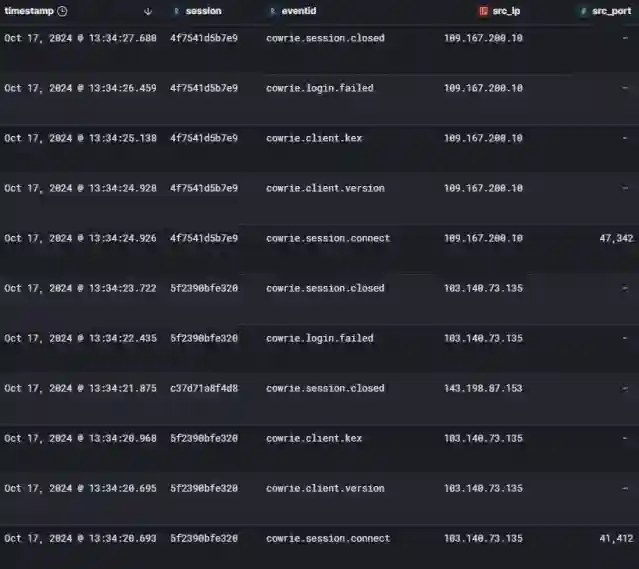
Below is a snippet of the Cowrie logs in my Elastic Index:
DShield Logs
DShield logs were stored in a near identical method as Cowrie logs. Combining all logs together, then pushing it to my index.
Web/HTTP Honeypot Logs
Webhoneypot logs were a little more complicated than the Cowrie & DShield logs as not all entries contained the same fields. Before beginning any cleaning, parsing, or uploading of data, I had to figure out the mappings for these logs to properly create their index. To do this, I created a Python script to list all fields that it was able to detect from the logs. Once this list was curated, I created the mappings and set up an index.
Next, I had to clean the data by removing duplicates, detecting improper entries, and fixing any potential issues. Once cleaned, I would combine all entries into a single JSON file.
After combining, the same approach for uploading the Cowrie/DShield logs was used.
Files Downloaded To Honeypot
Until recently, I manually uploaded each downloaded file used in previous analyses to VirusTotal. I later discovered that VirusTotal allows bulk hash uploads into a “Collection,” which displays all downloaded files’ detections, sizes, first/last seen dates, and more.
I created a Python script to save the hashes of each file into a list for easy entry into VirusTotal. Here is a link to view my collection: VirusTotal Collection - Login May Be Required
This collection also allowed me to upload files that had not previously been recorded on VirusTotal. Of the 9 new uploads, 7 had detections.
- CSV File - No Detections
- GZIP File - Detected - Trojan/Miner
- Text File - No Detections - Potentially an Instruction File, Permissions Test, etc
- ELF File - Detected - Miner
- Bash Shell File- Detected - Rule Matches - Downloader
- Bash Shell File - Detected - Rule Matches - Downloader.medusa
- ELF File - Detected - Rule Matches - Trojan.mirai/gafgyt
- ELF File - Detected - Miner
- Bash Shell File - Detected - Trojan
Auth_random.json
Auth_random was used for an entire attack observation of mine previously. I used a few scripts in this to analyze its information.
The primary script I used was a list that would take the auth_random.json file and create a CSV file with all unique user:password combinations. This data was used for me to describe such things as how complex passwords were compromised and how common specific passwords or usernames were.
A secondary script I used was to collect all IP addresses, their attempted combinations, and tries. This was used to describe how simple preventative measures like login attempt limitations and IP blocking would significantly decrease how many attacks could occur against a system.
With the IP addresses collected, I had another script map out each IP address to its geographical origin. Using GeoLite2-City.mmdb, I was able to associate each IP down to its city of origin. This was then used to give a visual world map of these IPs. Below is a map I previously included in an attack observation:
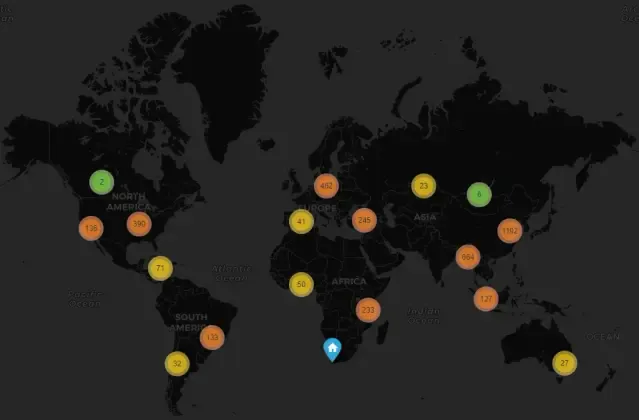
In a SANS course that I previously took, I read about a concept of Geo-Blocking IPs that originate from countries/cities that have no correlation to the system. For example, if a backend system on a website is used for a local business to interact with day-to-day office tasks, there is no reason an IP from Russia/China should have the ability to attempt a login to this backend page. These blocks significantly limit which IPs an attacker can utilize.
Honeypot Goals
The goal of these honeypots is twofold: to give threat actors the illusion that they are exploiting a vulnerable system, and to provide analysts with raw information on attacks that could occur on their own or any system.
My honeypot has provided information on various attack methods. Below is a list of a few of the ATT&CK Techniques I observed throughout this internship:
- Initial Access:
- T1190 – Exploit Public-Facing Application:
- Initial Access is the basis; most of these attackers attempted to access the system by attempting to exploit some vulnerability to gain access to the system, SSH being one of the most common methods.
- T1190 – Exploit Public-Facing Application:
- Execution:
- T1059 – Command and Scripting Interpreter:
- A large portion of the attackers attempted many common methods and techniques to execute their attacks once they were in the system. The use of exploits against the shell were common. One notable observation was how an attacker used the echo command to rebuild a potential malicious payload. Using echo was a simple way for the attacker to avoid detection as the echo command does not typically require a higher privileged account to run. This gave the attacker a simple form of execution without having to worry about the system blocking their attempts or not having the necessary services, software, or tools that may not be typically available on all Linux based systems.
- T1569 – System Services:
- This was another common form of attack as attackers would attempt to execute services in an attempt to pivot through the system.
- T1059 – Command and Scripting Interpreter:
- Persistence:
- T1098 – Account Manipulation:
- Attackers were often seen tried to create accounts in an attempt to maintain access. If account creation was not the method, the account they were currently logged into would, at times, be used for a backdoor into the system.
- T1547 – Boot or Logon Autostart Execution:
- Another method of attack persistence was the attempts to create services or scripts that can maintain access for the attacker even upon reboot, etc.
- T1098 – Account Manipulation:
- Credential Access:
- T1110 – Brute Force:
- Brute force was a commonality within the logs, especially when I would take a look into files such as auth_random or the cowrie logs. Some attackers would attempt thousands of brute force attempts to login with a variety of user:password combinations.
- T1552 – Unsecured Credentials:
- I took notice of some attackers that attempted to locate credentials via the Shadow/passwd files.
- T1110 – Brute Force:
- Discovery:
- T1082 – System Information Discovery:
- A large count of the tty logs displayed attacker attempts to understand and enumerate various details about their environment. Using commands such as uname -a and whoami were seen in many instances.
- T1016 – System Network Configuration Discovery:
- Attackers would also attempt to understand their current environment’s network by running commands that would detail such information, ipconfig and netstat being common. In a previous attack observation, I noted how an attacker attempted to enumerate other local network devices, a possible indication of the start to a lateral movement attack.
- T1082 – System Information Discovery:
- Lateral Movement:
- T1021 – Remote Services:
- Another common attack method which attackers attempted breaches using SSH.
- T1021 – Remote Services:
- Collection:
- T1005 – Data from Local System:
- The TTY logs indicated a large portion of attackers attempting some level of detecting sensitive data for either exfiltration or further attackers within the system or network (ex. Privilege Escalation or Lateral Movement)
- T1005 – Data from Local System:
- Exfiltration:
- T1041 – Exfiltration Over C2 Channel:
- Many attacks displayed an attacker’s attempts to setup a form of C2 communication. Some attackers would download malicious files to the system to setup C2 communications with their own servers to either attempt persistence or exfiltration.
- T1041 – Exfiltration Over C2 Channel:
- Impact:
- T1486 – Data Encrypted for Impact:
- Attackers may have downloaded potential ransomware files which could encrypt local data and demand payment for decryption.
- T1496 – Resource Hijacking:
- A batch of the downloaded files were discovered to be coin miners to some level. Attackers can utilize system resources for crytpo miners.
- T1486 – Data Encrypted for Impact:
Attacker Goals
This honeypot highlights that most attackers simply want to use compromised systems for their own profit or needs. Even a handful of the downloaded files show attempts to create botnets, crypto miners, data exfiltration methods, and more. Each of these methods provides some form of profit for the attackers.
Botnets allow an attacker to essentially turn a system into a “zombie” that can do whatever the attacker pleases. Such uses for a botnet could be DDOS attacks or systems that can be used for further breach attempts into other systems around the globe.
Crypto miners are, quite literally, a form of profit for an attacker. Their only investment is breaching into a system—once inside, the crypto miner generates profit for the attacker while all the costs to run it fall on the victim. It’s essentially a money printer for these malicious actors.
Data exfiltration is also another key method for profit in these attacks. If an attacker is able to breach into a corporation’s servers, for example, Twitter’s or Facebook’s servers, the data contained within those servers can be sold in underground markets for a large price. In an attack that occurred earlier this year on National Public Data, leaked highly sensitive information on millions of U.S. citizens which included data such as full names, addresses, and even Social Security Numbers. The hacking group who exfiltrated this data set a purchase price of $3.5 Million, setting data exfiltration as one of the most profitable attacks an attacker can make.
Everyday Vulnerabilities
One of the goals of a honeypot is to expose potential vulnerabilities in a network. Honeypots reveal potential attack vectors that organizations may not have considered or protected against. If an actual production system was set with the same vulnerabilities that a honeypot opens up, that system would be extremely vulnerable to even some of the most basic and avoidable attacks. A compromise could only be minutes away once that system is brought online with those vulnerabilities.
Mitigations & Defense
Analyzing the logs from this honeypot reveals several effective protections. The simplest form of protection would be to “jail” known-bad IPs from ever attempting to access the system in the first place.
Additional mitigations include:
- Using complex passwords, MFA, SSH keys, and login attempt restrictions to limit most attacks on the SSH service.
- Proper port forwarding, management, and monitoring to increase protections.
- Regular patching and the use of intrusion detection systems to significantly reduce attack vectors.